> ## Documentation Index
> Fetch the complete documentation index at: https://docs.anygen.io/llms.txt
> Use this file to discover all available pages before exploring further.
# September 2025
> New features and improvements released in September 2025.
## ✨ Slides Feature Now Available
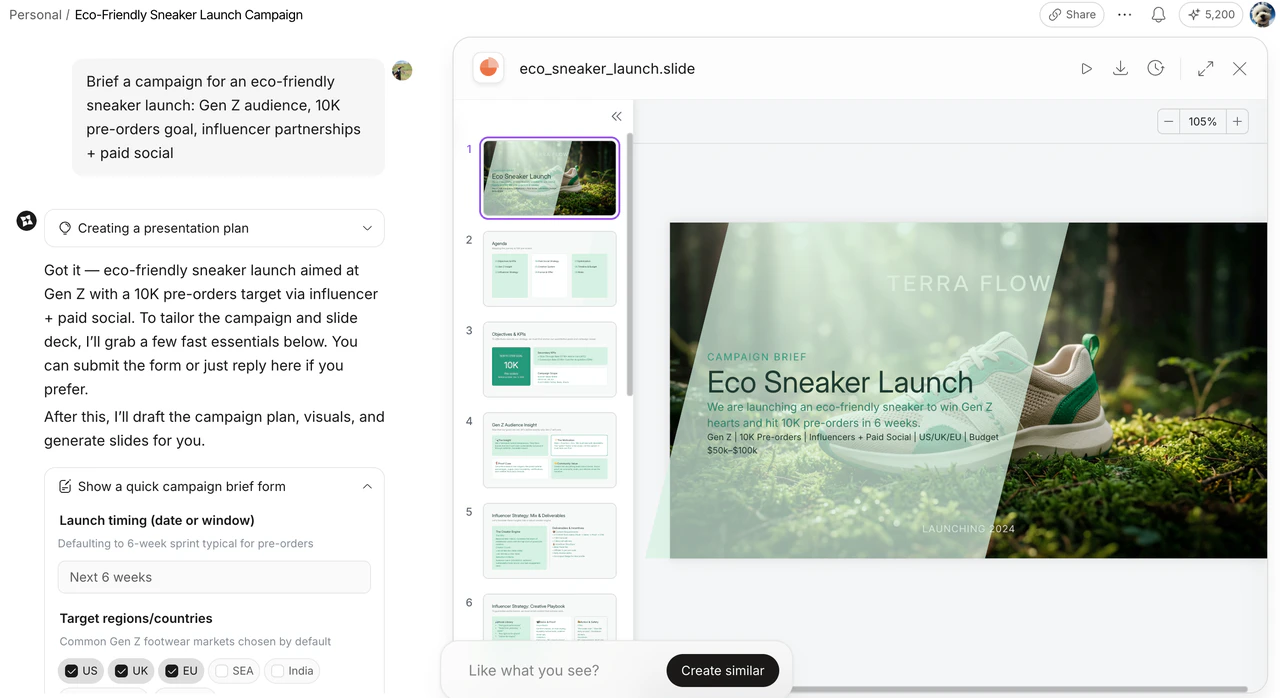
* Generate structured presentations directly through chat, from requirements to finished slides.
* Fine-tune outlines and hierarchy page by page during generation.
* Convert existing documents into slides with one click.
* Iterate precisely through multi-turn chat until you’re satisfied.
* Export clean, watermark-free slides for professional use.
* Export presentations in watermark-free .pptx format.
 ## ✨ Storybook Feature Now Available
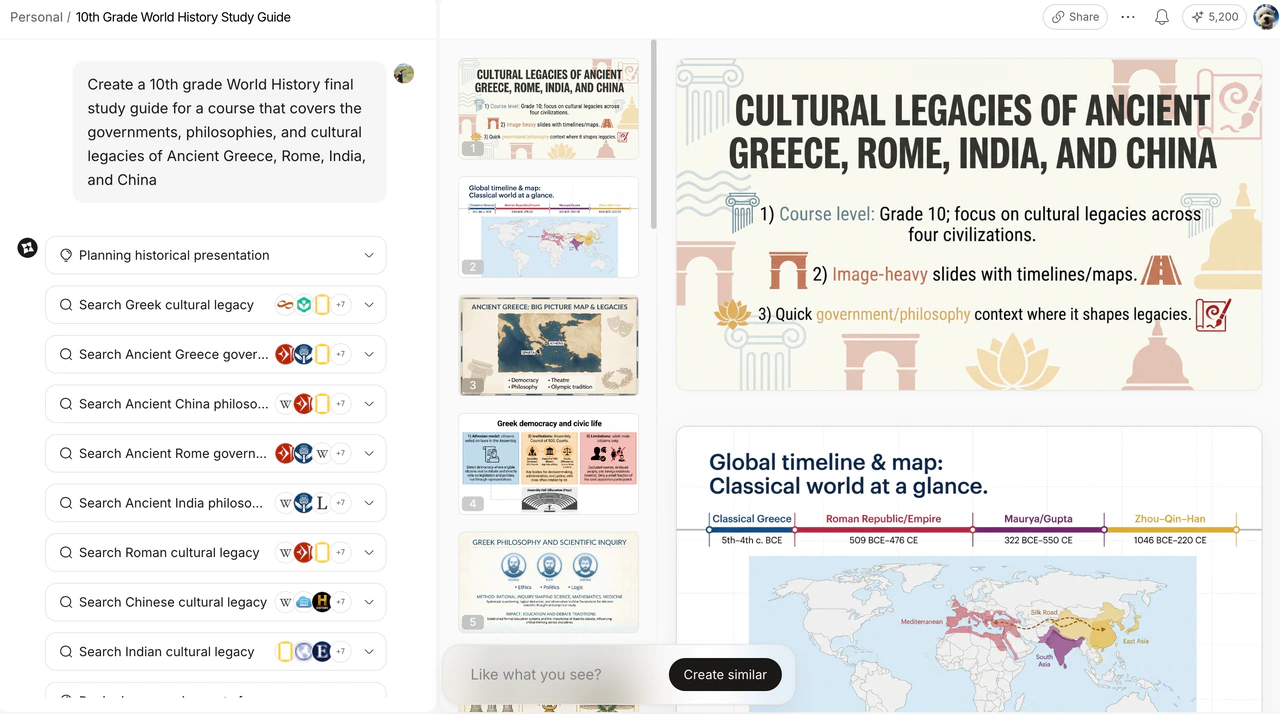
* Uses an image-first generation model, where each page is a visual generated by a vision model.
* Ideal for scenarios requiring strong visual storytelling and consistent style.
**Typical Use Cases:**
* Science education, e.g., lunar eclipse presentations for children or clay-style storybooks about bee ecosystems.
* Fairy tale illustration, generating characters, scenes, and key story elements.
## ✨ Storybook Feature Now Available
* Uses an image-first generation model, where each page is a visual generated by a vision model.
* Ideal for scenarios requiring strong visual storytelling and consistent style.
**Typical Use Cases:**
* Science education, e.g., lunar eclipse presentations for children or clay-style storybooks about bee ecosystems.
* Fairy tale illustration, generating characters, scenes, and key story elements.
 ## 📊 Data Analysis Feature Now Available
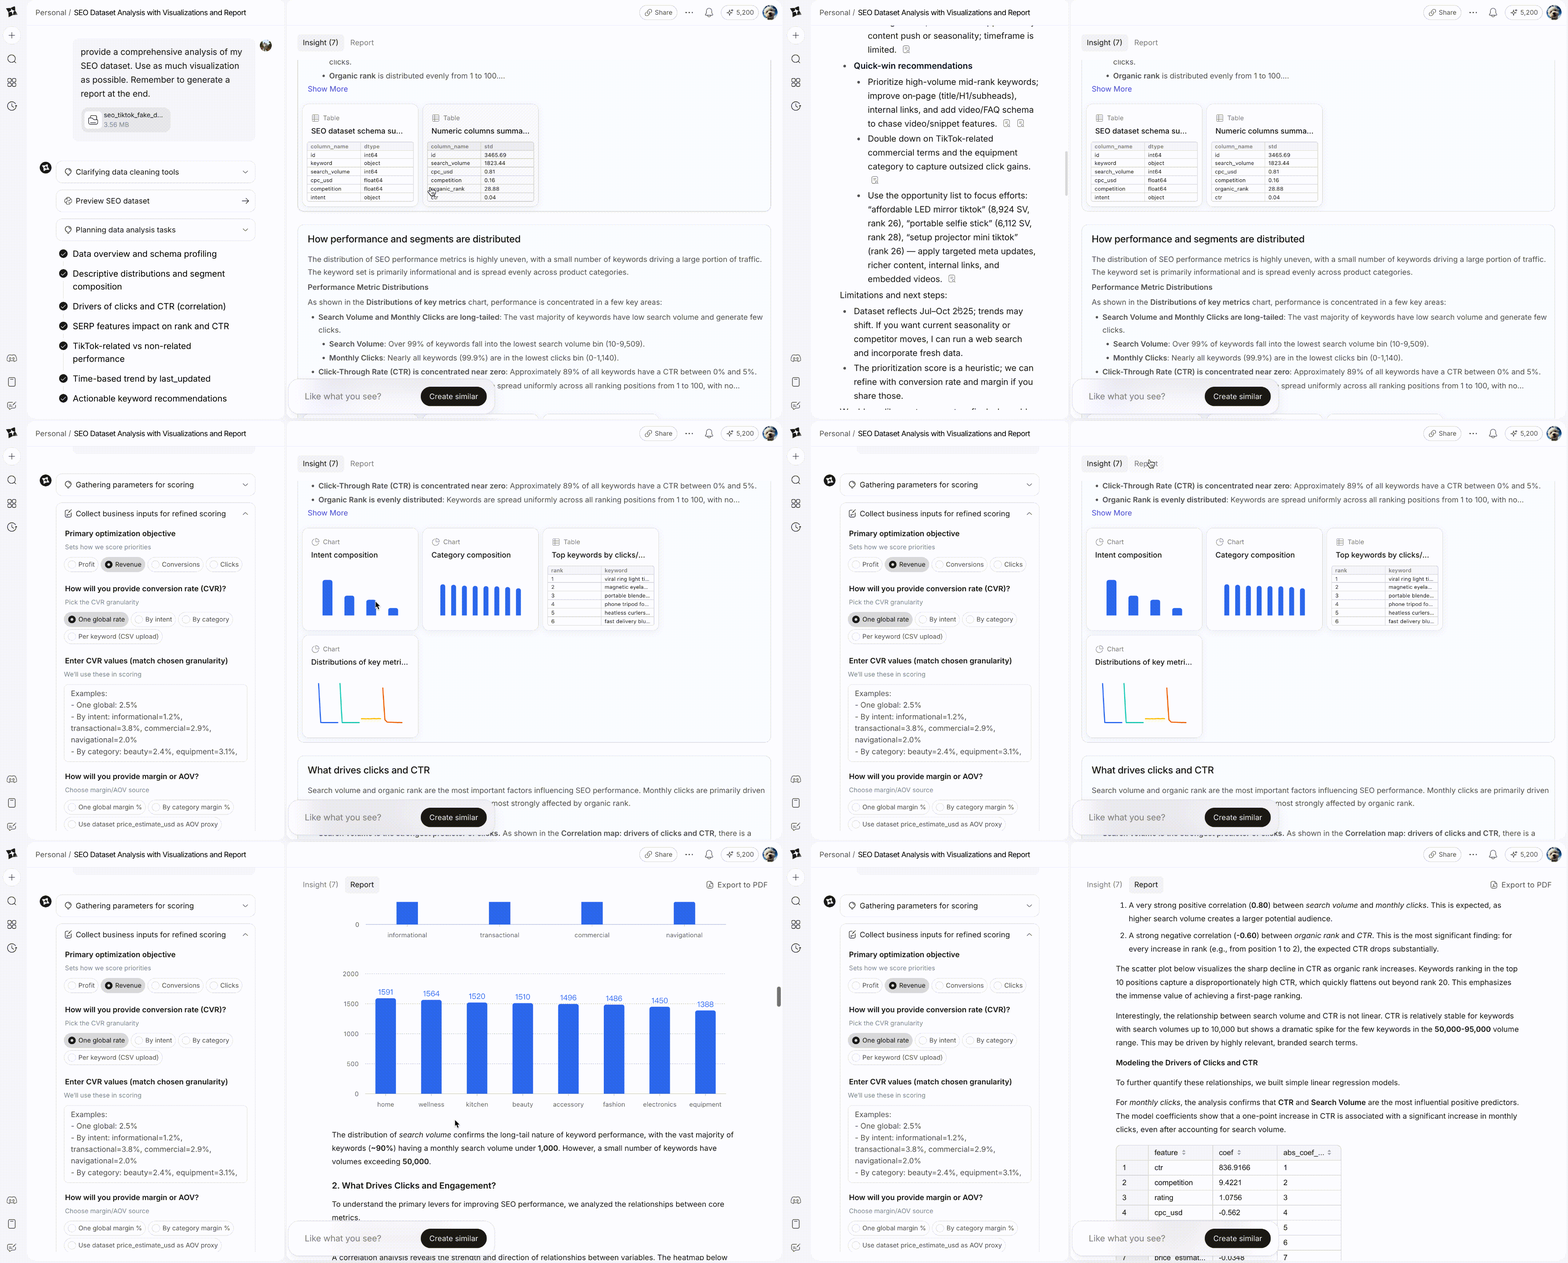
* Provides end-to-end data analysis, from data validation to final insights.
* Clarifies analysis goals, perspectives, rigor, and output format before execution.
* Breaks down the analysis into clear phases and tasks.
* Generates intuitive and well-designed visual charts.
* Extracts key insights and provides actionable recommendations.
## 📊 Data Analysis Feature Now Available
* Provides end-to-end data analysis, from data validation to final insights.
* Clarifies analysis goals, perspectives, rigor, and output format before execution.
* Breaks down the analysis into clear phases and tasks.
* Generates intuitive and well-designed visual charts.
* Extracts key insights and provides actionable recommendations.